Reporting Platform
Join is project management for the people who build actual buildings. As Head of Design, I lead a small team and ship product across the platform.
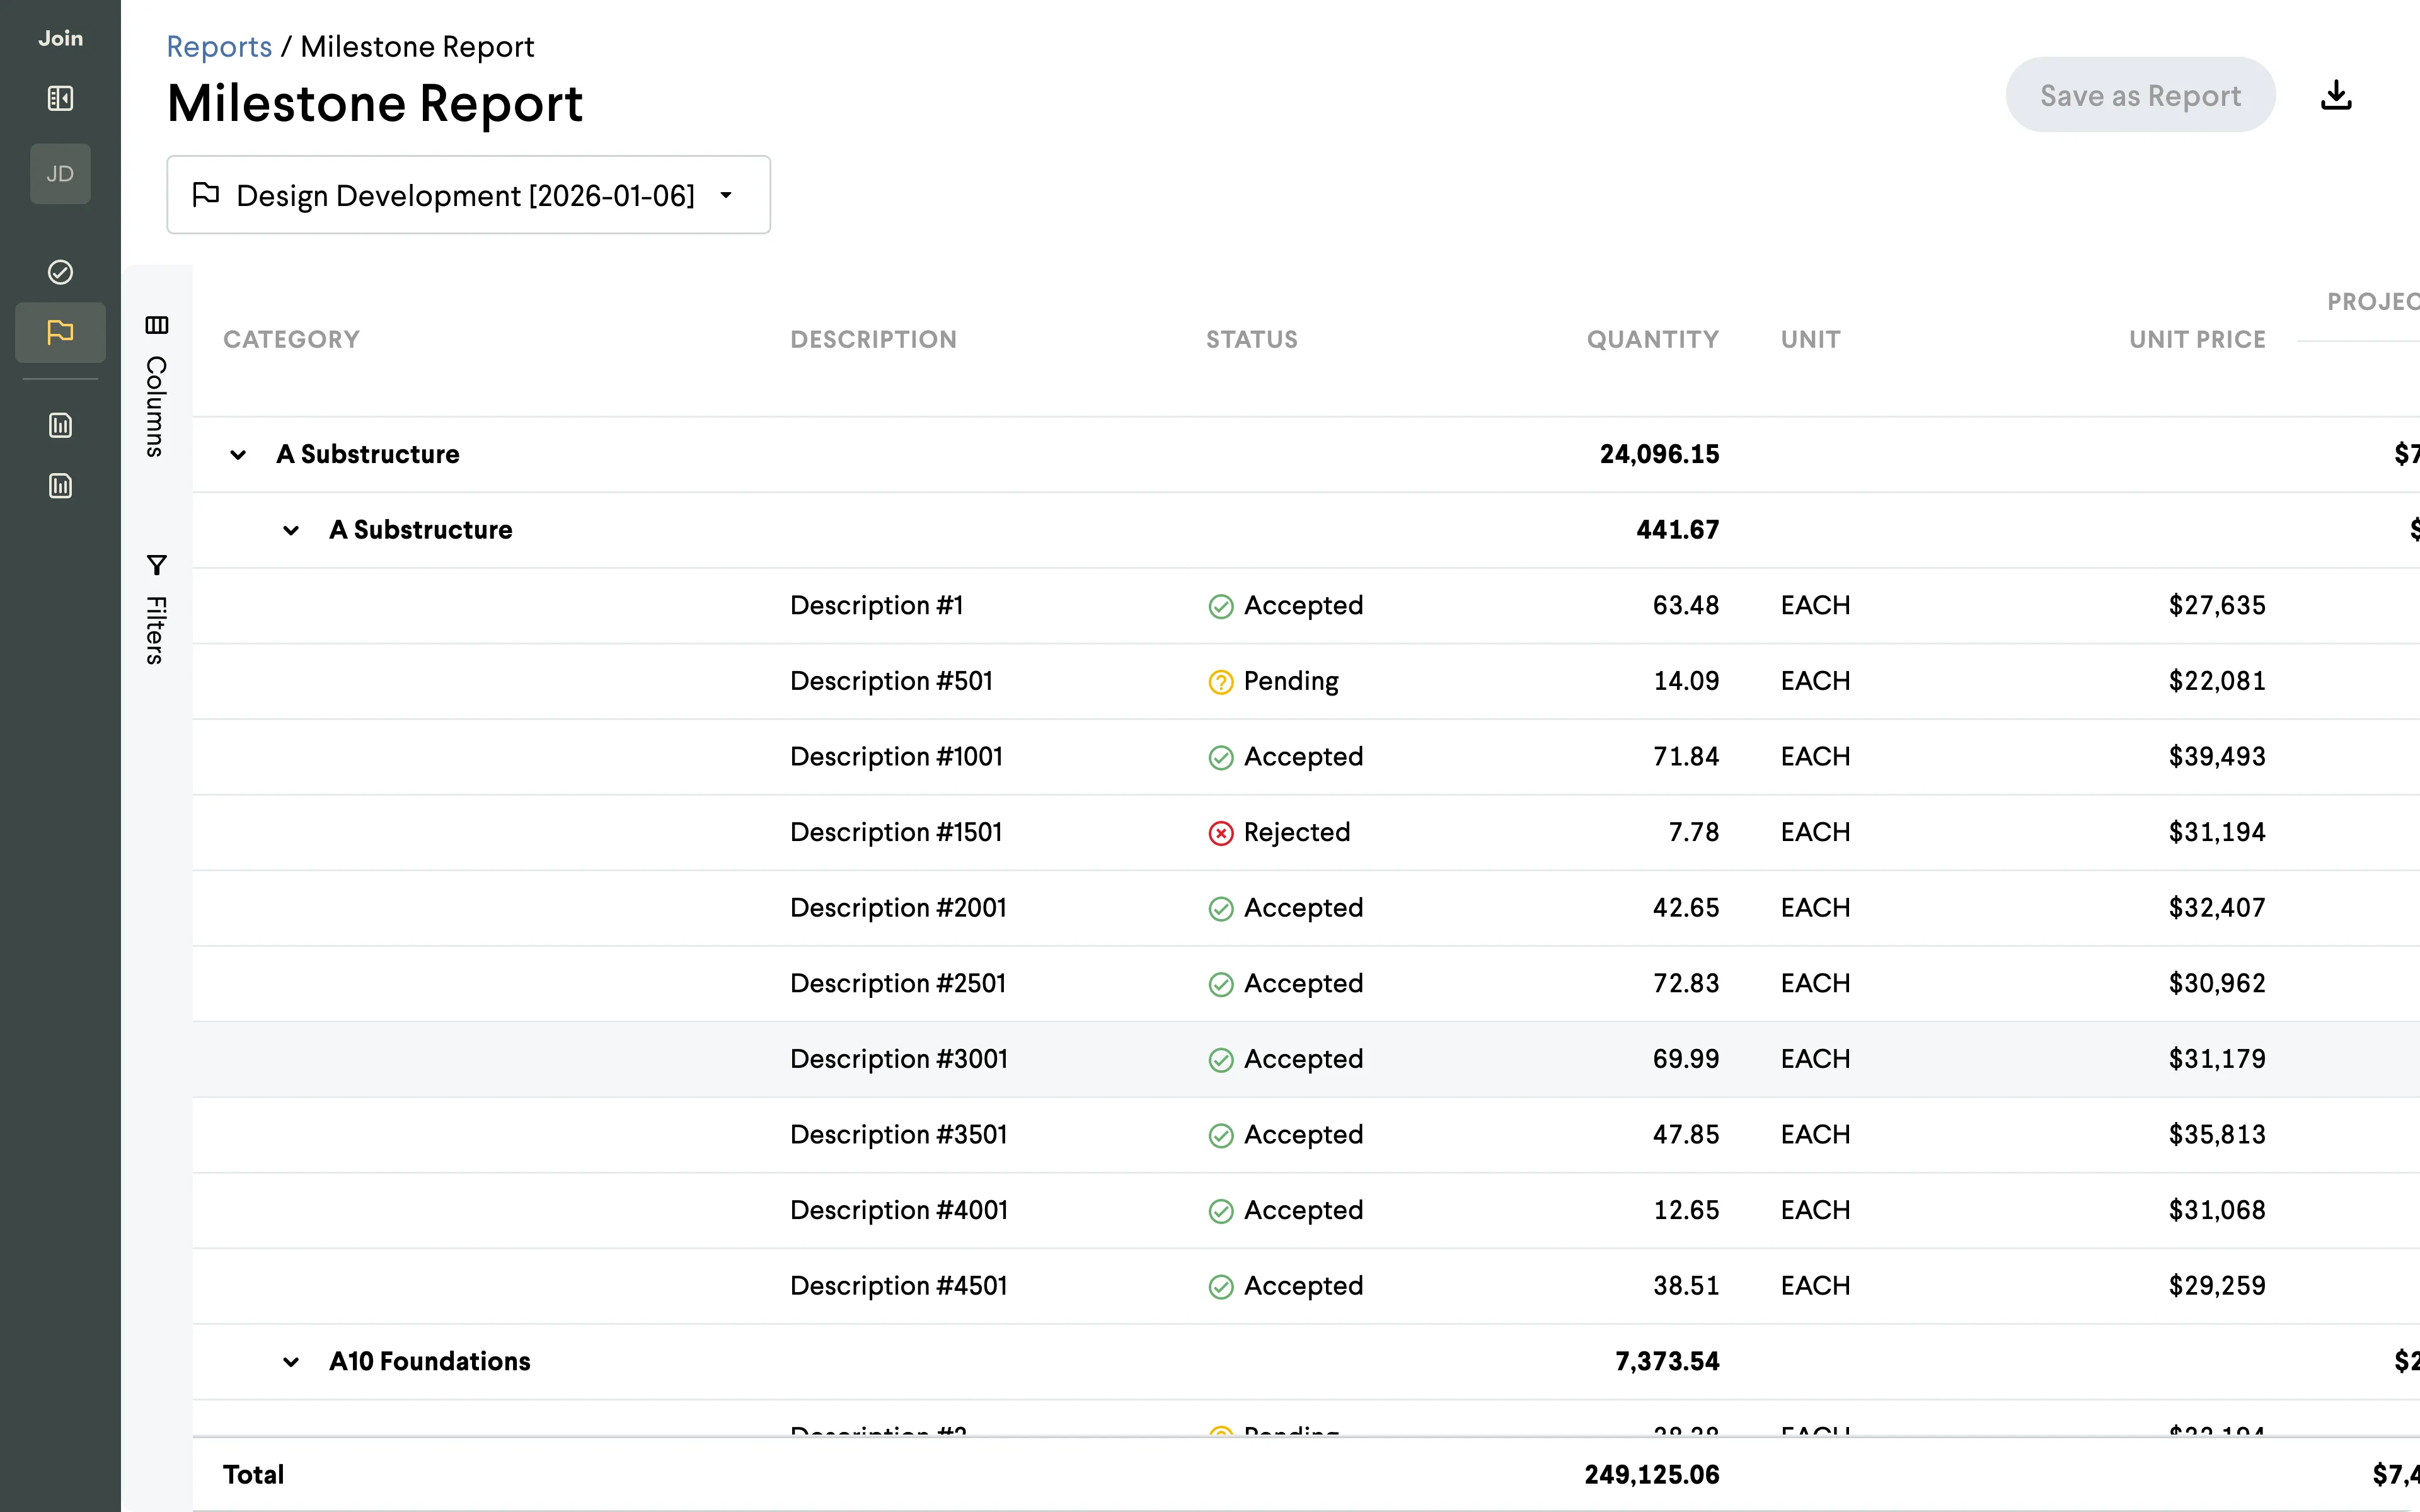
Reports are how preconstruction teams earn an owner’s trust. The Items Report is the working surface where decisions, costs, and status get filtered into the packet that lands in front of an owner on a Friday. Customers like Webcor, Leopardo, and McCarthy were spending 5 to 10 hours a week exporting from Join, then stitching PDFs together in Bluebeam to build one coherent submission. We heard from estimators that the existing Report Builder was too limited for complex projects and too complicated for simpler ones, and that skilled Preconstruction Managers were reverting to Excel macros to get around it.
We treated reports as a primitive every Join feature plugs into, not a downstream artifact.
One data shape, two surfaces
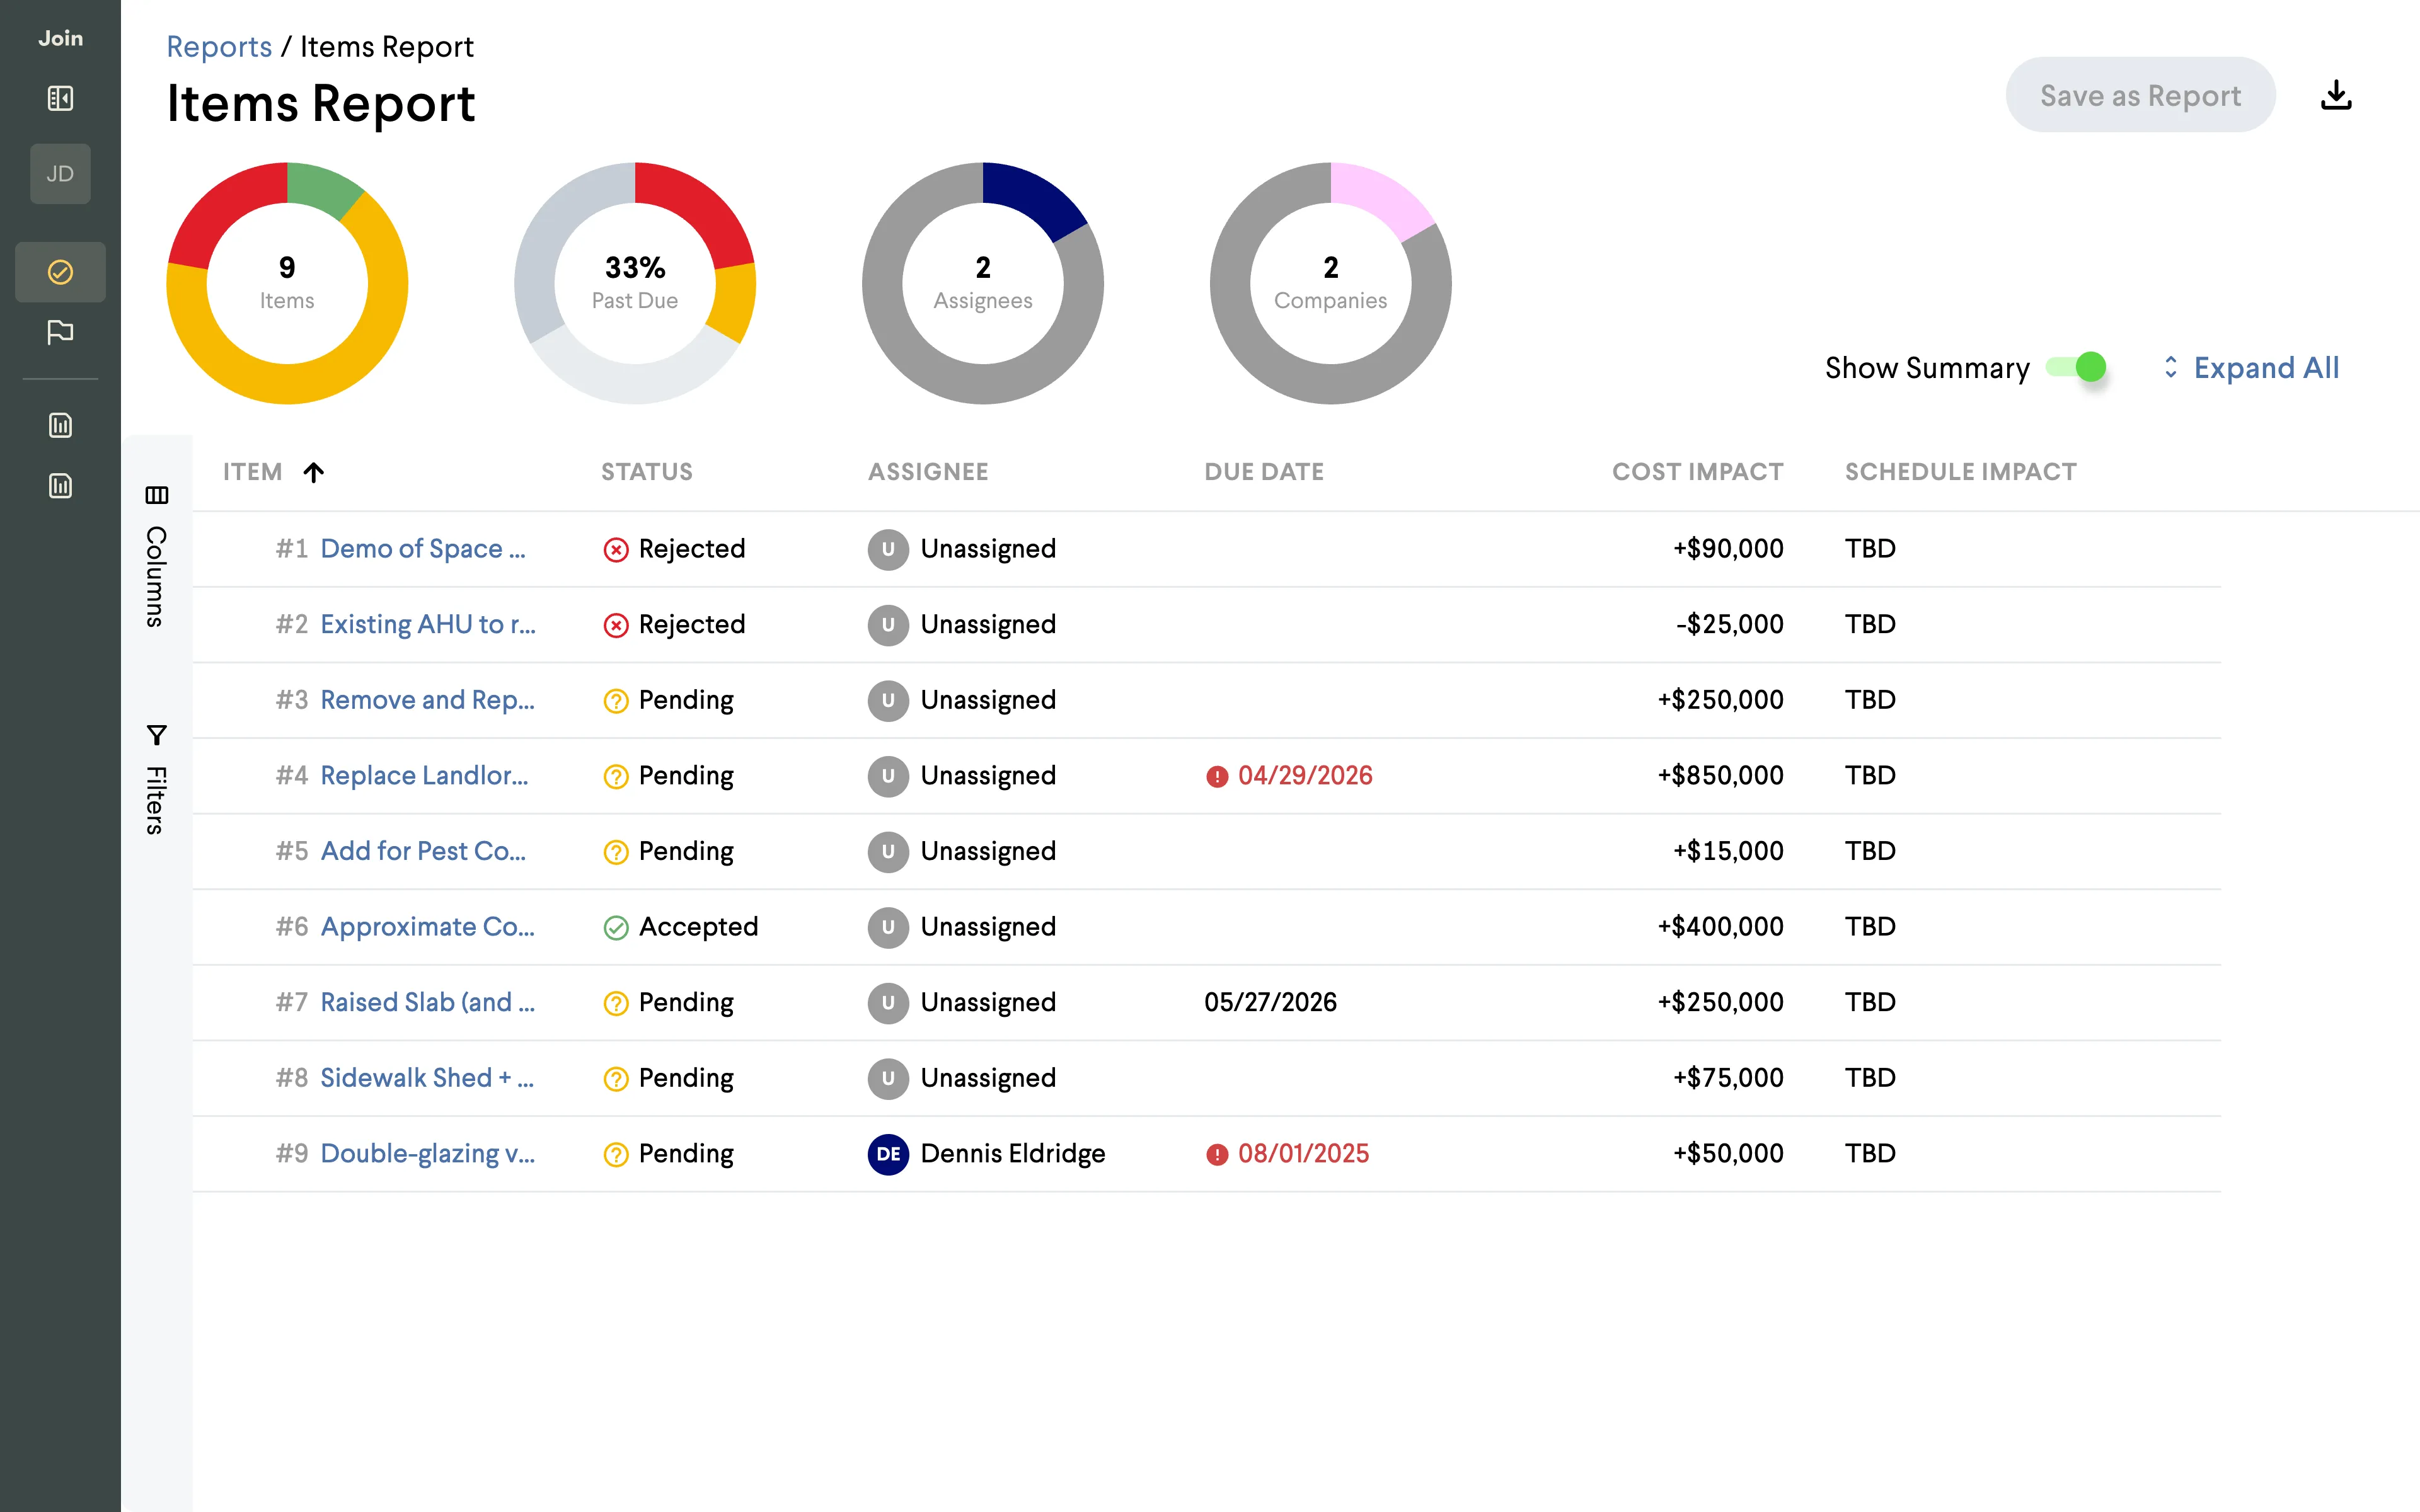
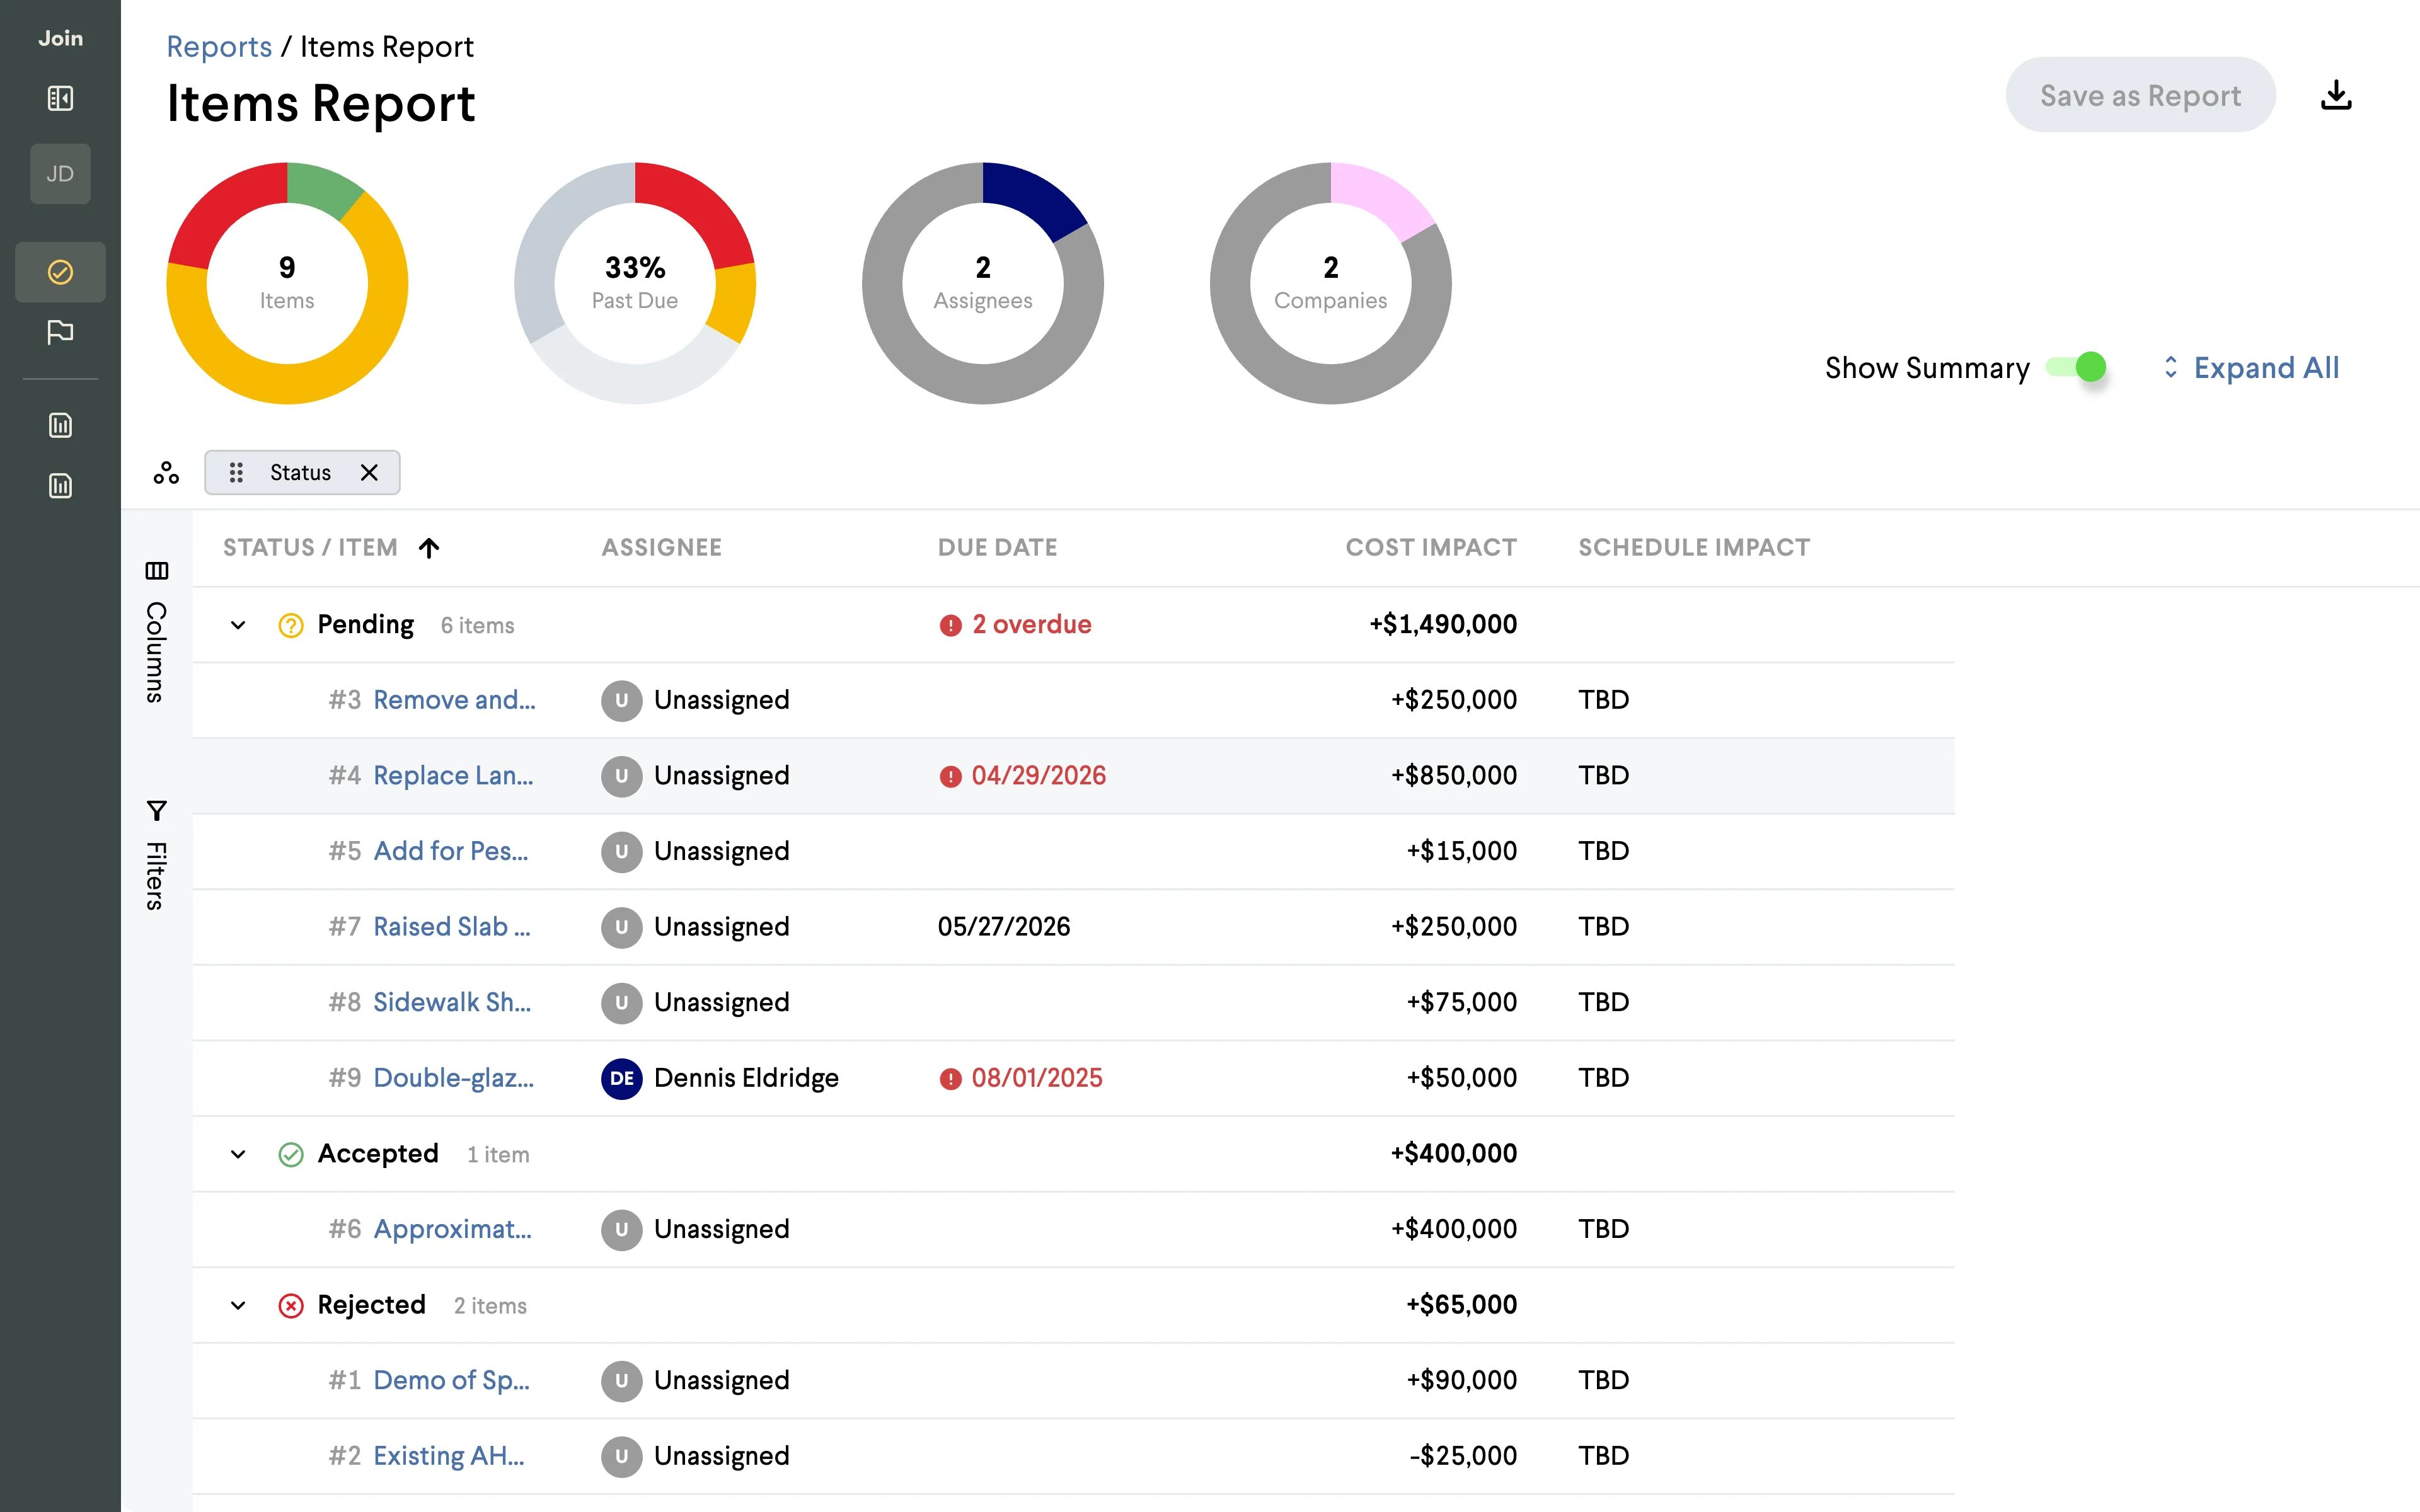
AG Grid Enterprise drives the on-screen working view — filter, sort, group, pin, resize before anyone exports anything. For the export side we picked @react-pdf/renderer, a React component model with real typographic control, so a single primitive could live in both places without a translation layer. Both consume the same data shape, so what you arrange in the grid is what comes out the other side. We built the prototype in code rather than Figma so it could feel like a live product against real data when customers reviewed it.
Bringing Scales into the PDF
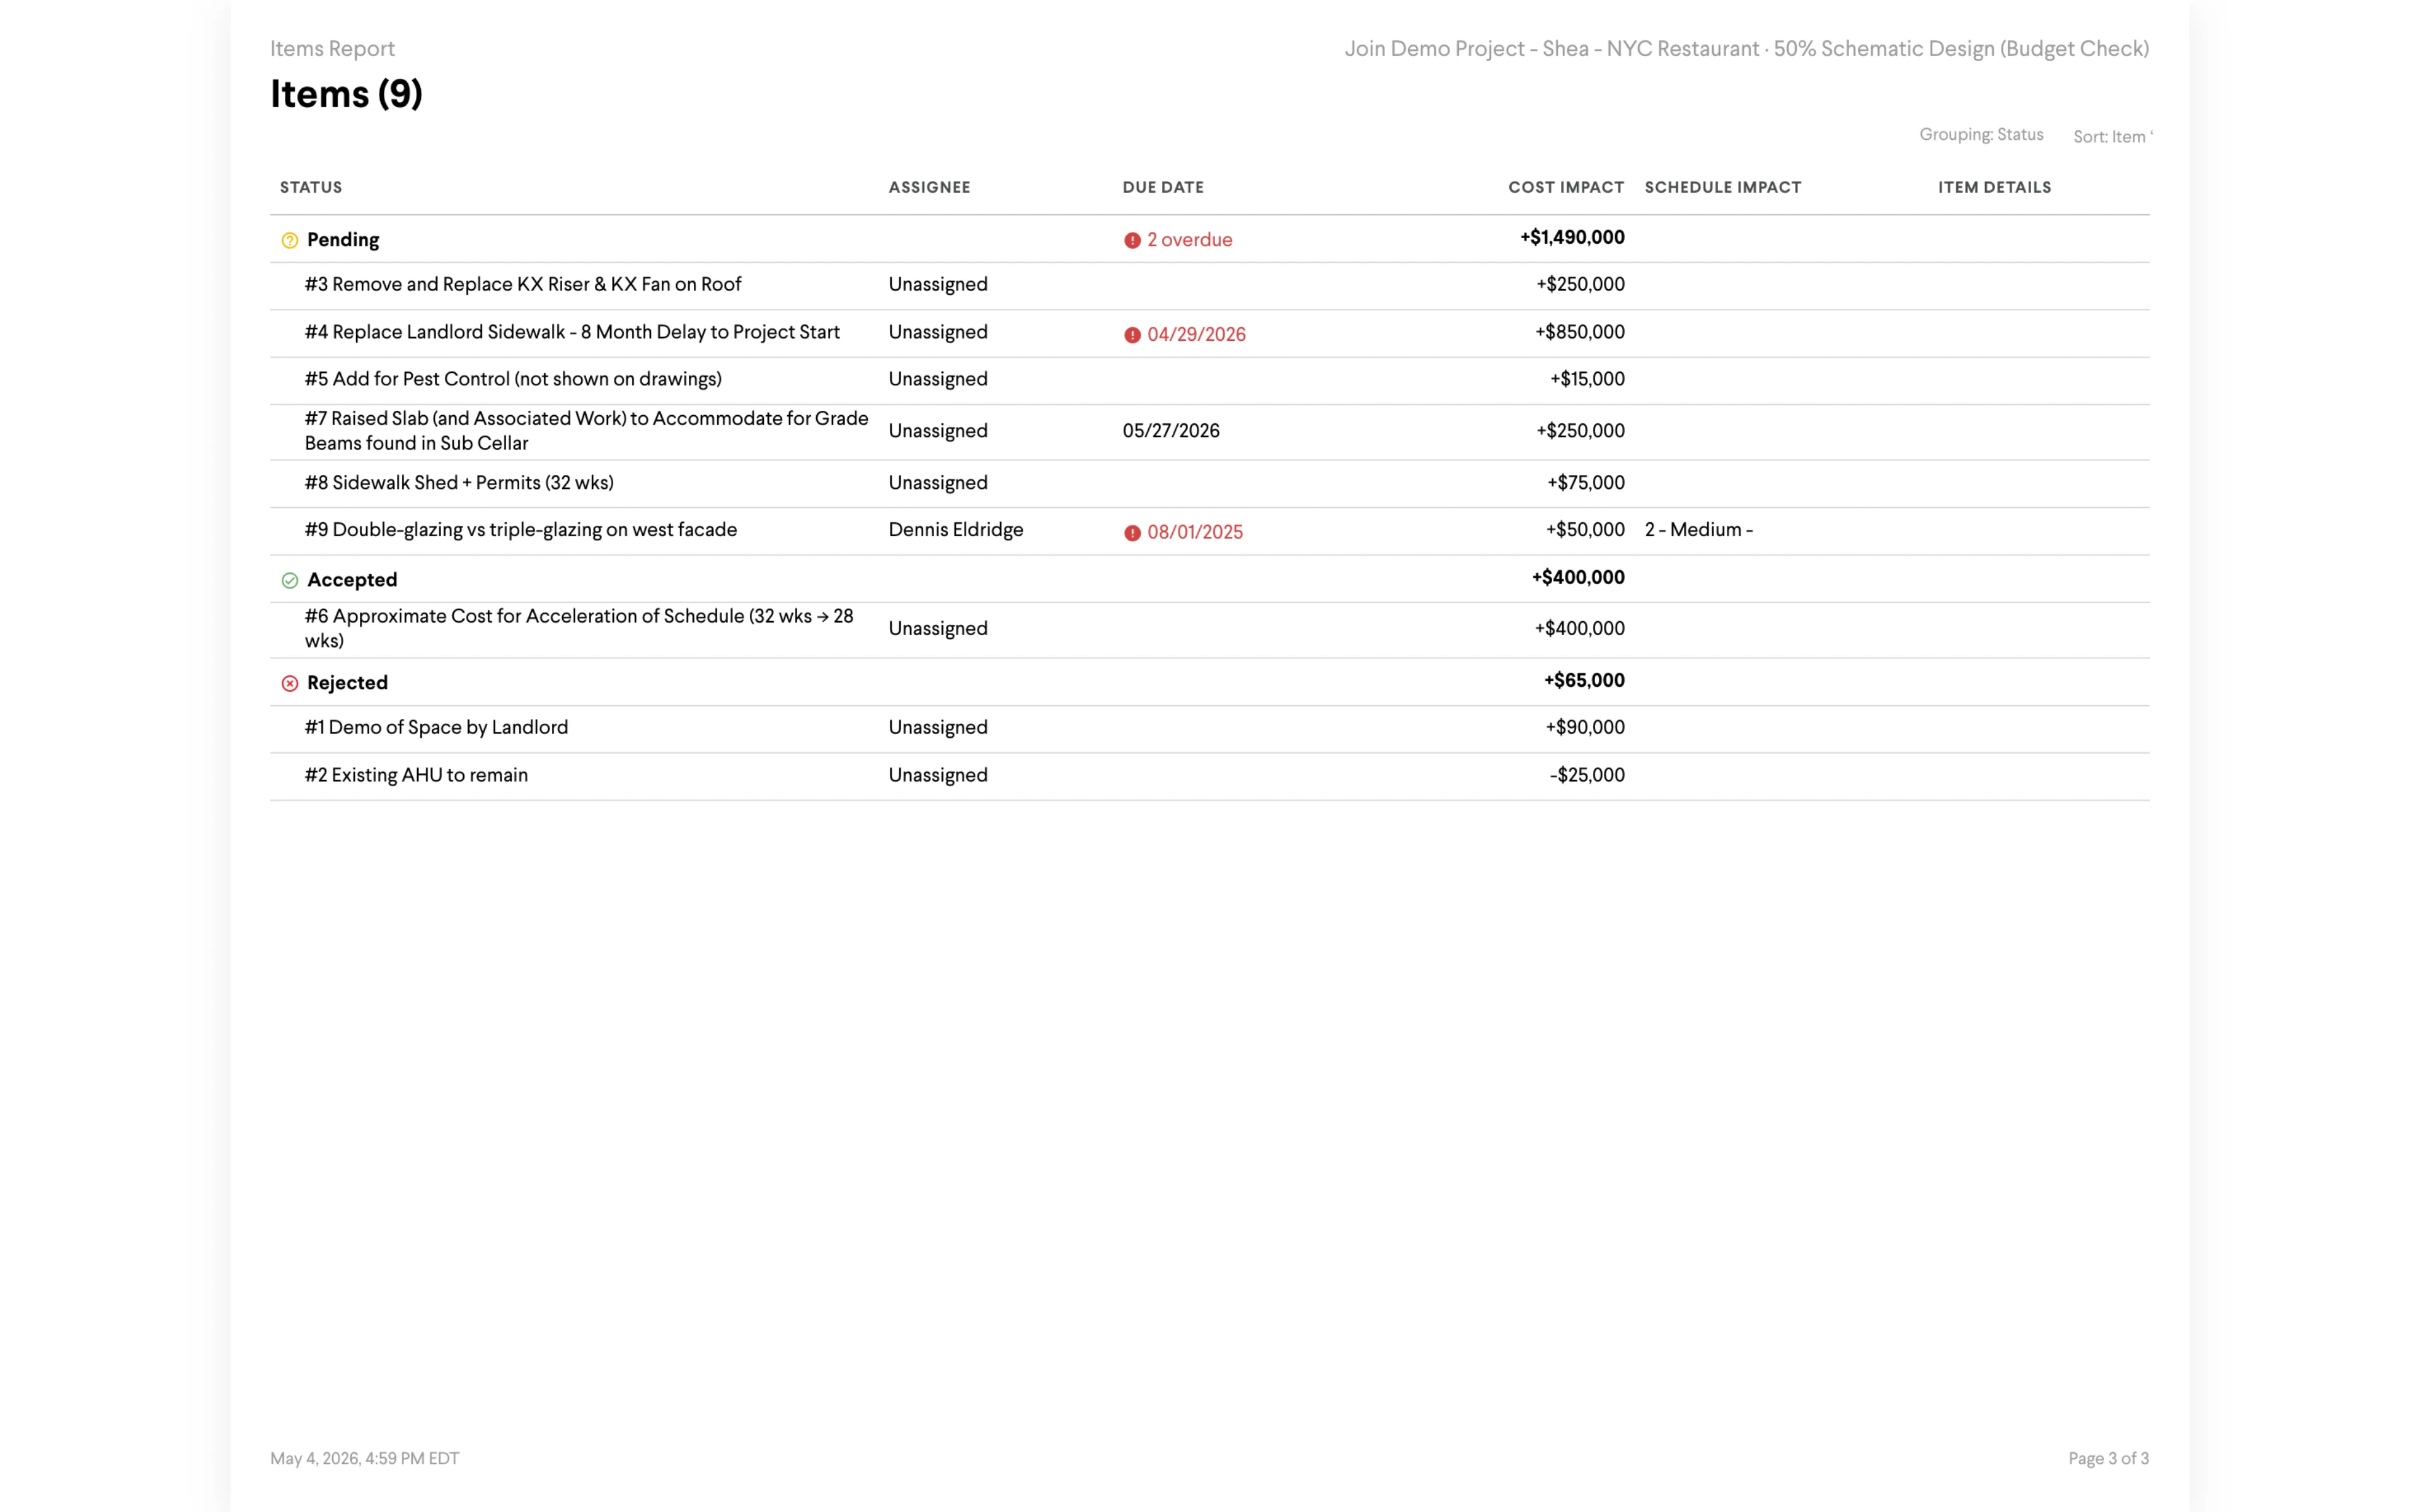
The harder design problem was making the PDF feel like Join, not like a generic export. We rebuilt our Scales primitives inside react-pdf — PDFTable, PDFScalesDonutChart, a thin set of pdfTokens — so the PDF could use the same type styles and chart styles as the web. Whatever you arranged in the grid — group-bys, filters, sort order — carried through to the export, with the same donut colors and a filter bar locked to every header.
Designing for screens, not paper
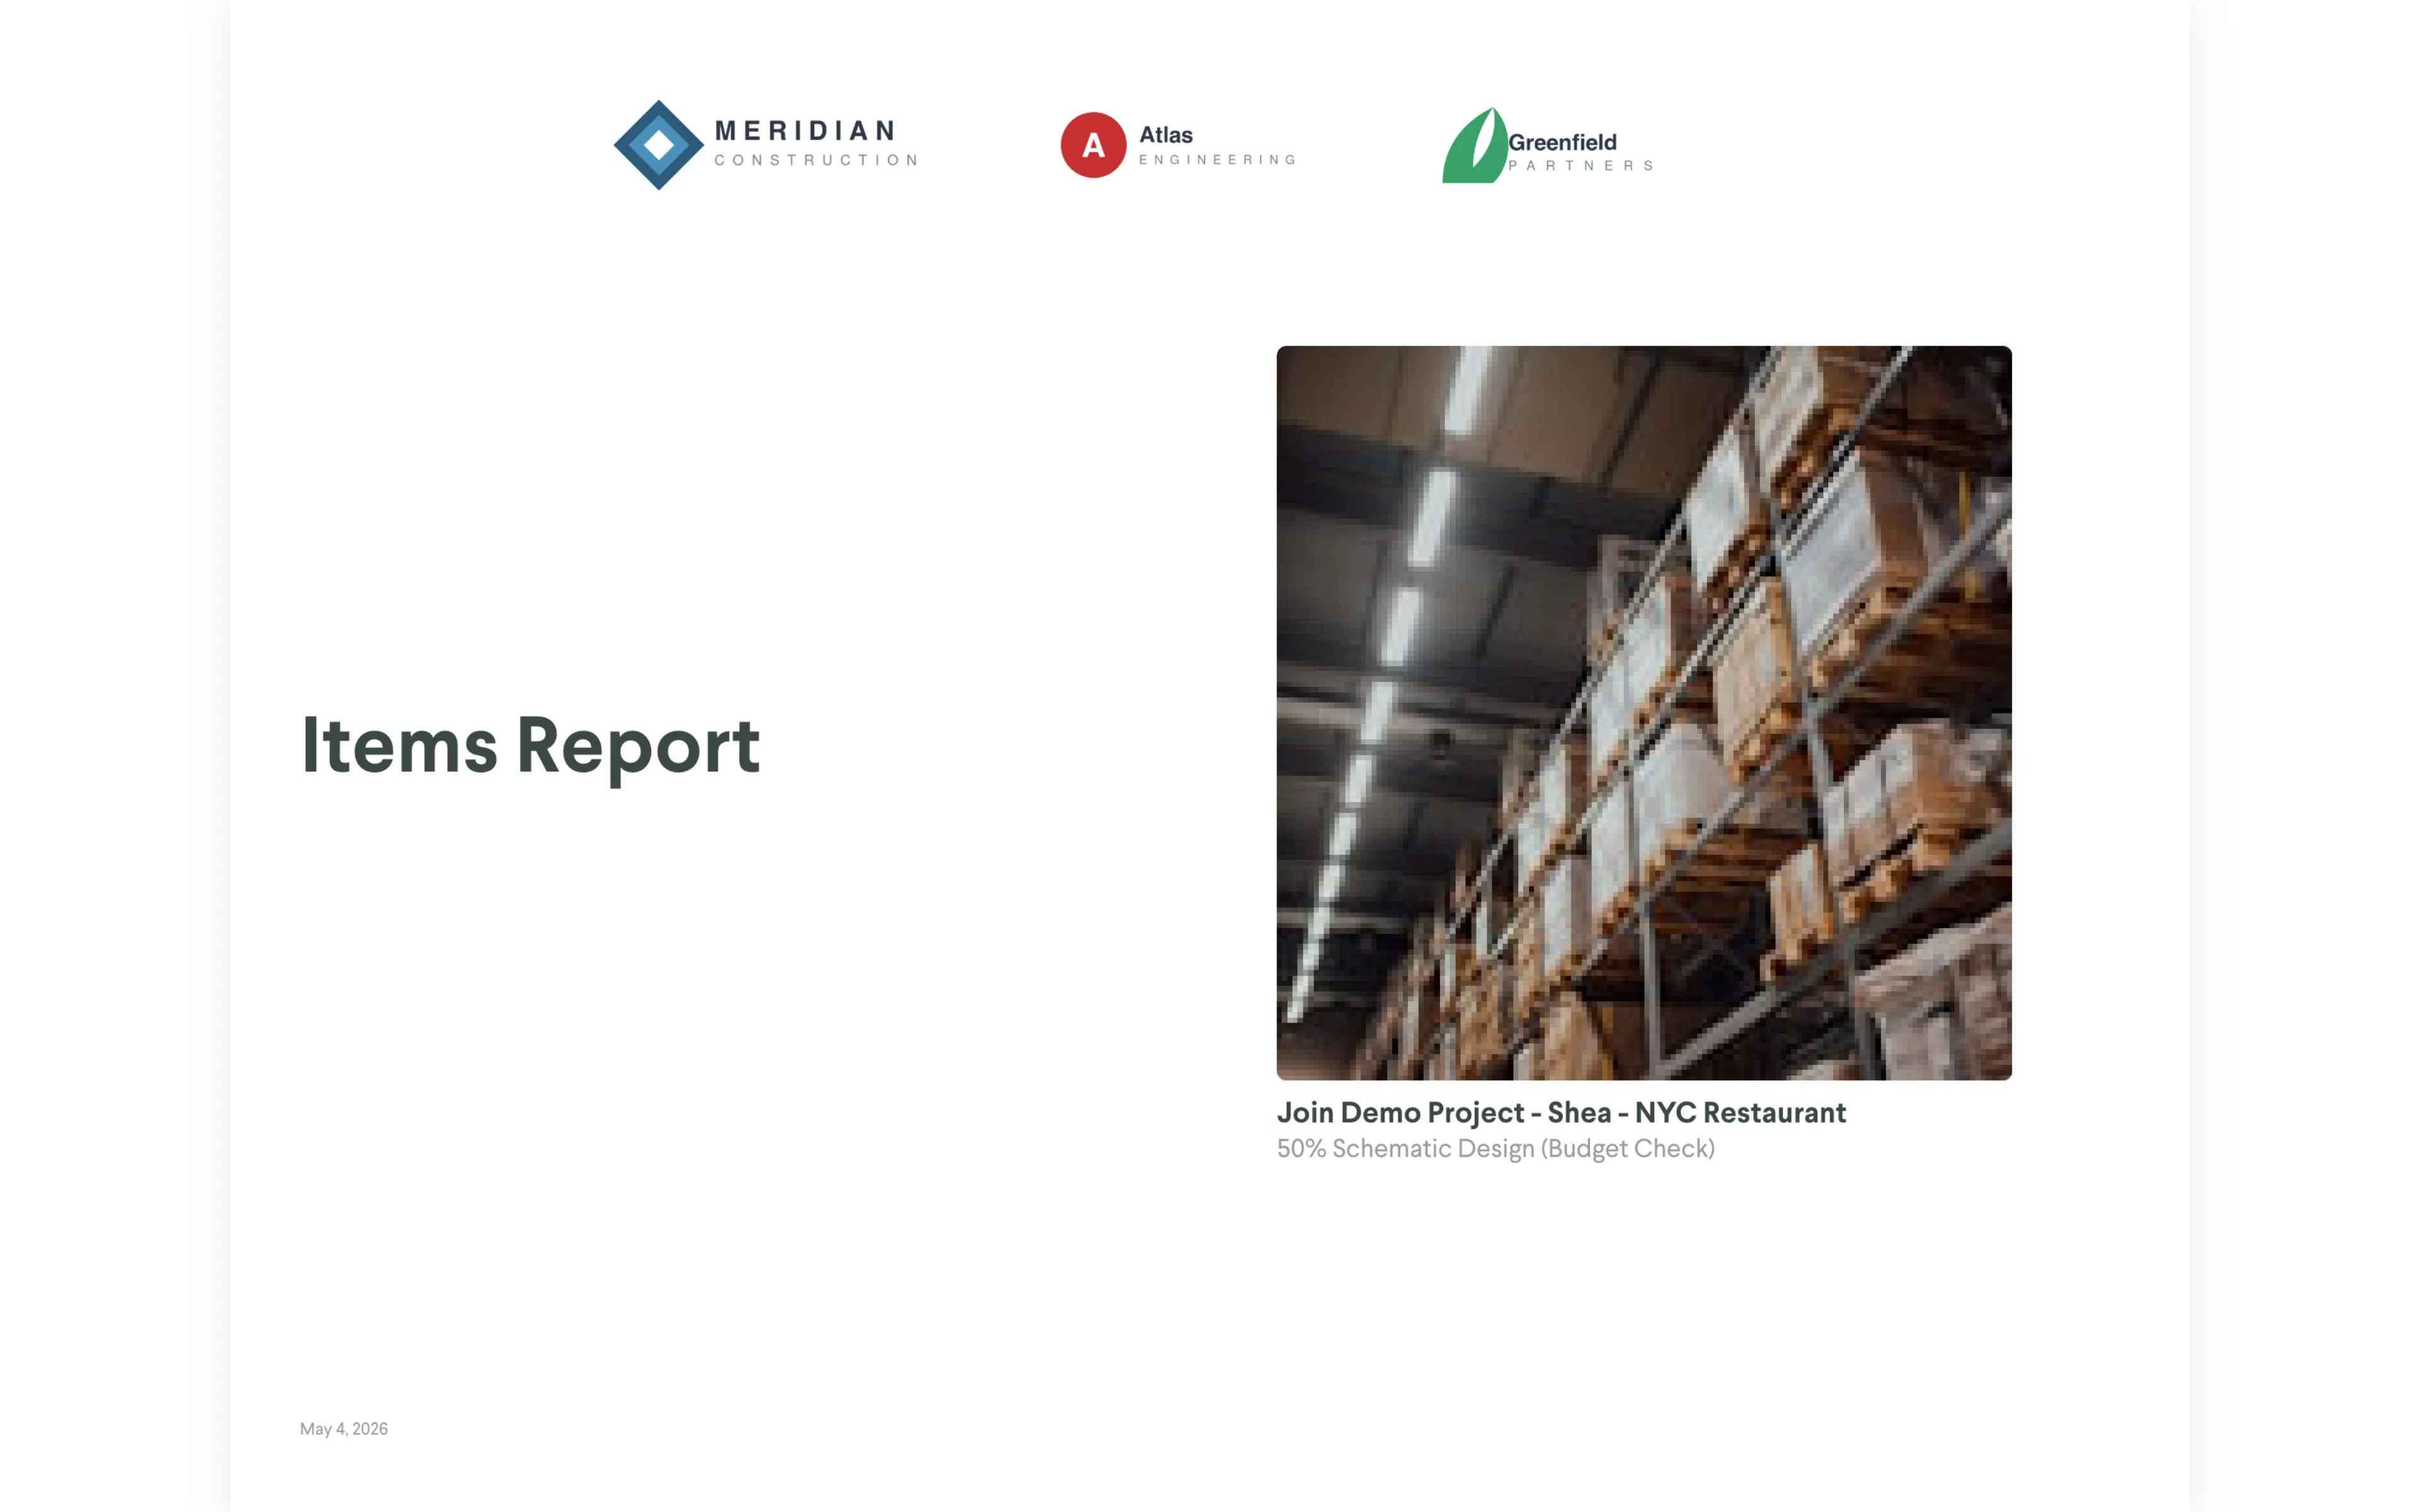
We started this thinking PDFs would be printed and designed page layouts for Letter, A4, and 11x17. A customer call reframed it: PDFs are almost never printed. They’re viewed on desktop, often inside 500-page submission packets. Dynamic page sizing became the top customer ask, and the “Generated by Join” footer came out the same week — customers have strict branding rules and the packet is theirs, not Join’s.
Results
About 25 PRs over two months, AI-coded against real anonymized customer data. The top 20 validated customer requests landed in the prototype, and we put a fresh build on leadership’s desk every Monday. That cadence got PM, engineering, and leadership aligned on reports as primitives. Risks and Buyout reports now plug into the same standard.
Credits
In flight at Join, 2026.
Impact
5–10
Hours per week customer teams spent stitching PDF packets before
Top 20
Validated customer requests addressed in the prototype
~25
PRs landed in roughly two months, AI-coded against real data