Ari Zilnik
Developer Tools Gradle Lead Designer

Replacing a dozen dropdowns with one input that served both experts and beginners

Flexible filtering for novices and experts.

Replacing a dozen dropdowns with one input that served both experts and beginners

Gradle builds developer productivity tools. Large engineering orgs like Netflix and Salesforce use Gradle Enterprise to keep CI/CD pipelines healthy. As lead designer, I owned how those teams diagnosed slow tests and tracked down flaky failures across thousands of daily builds.

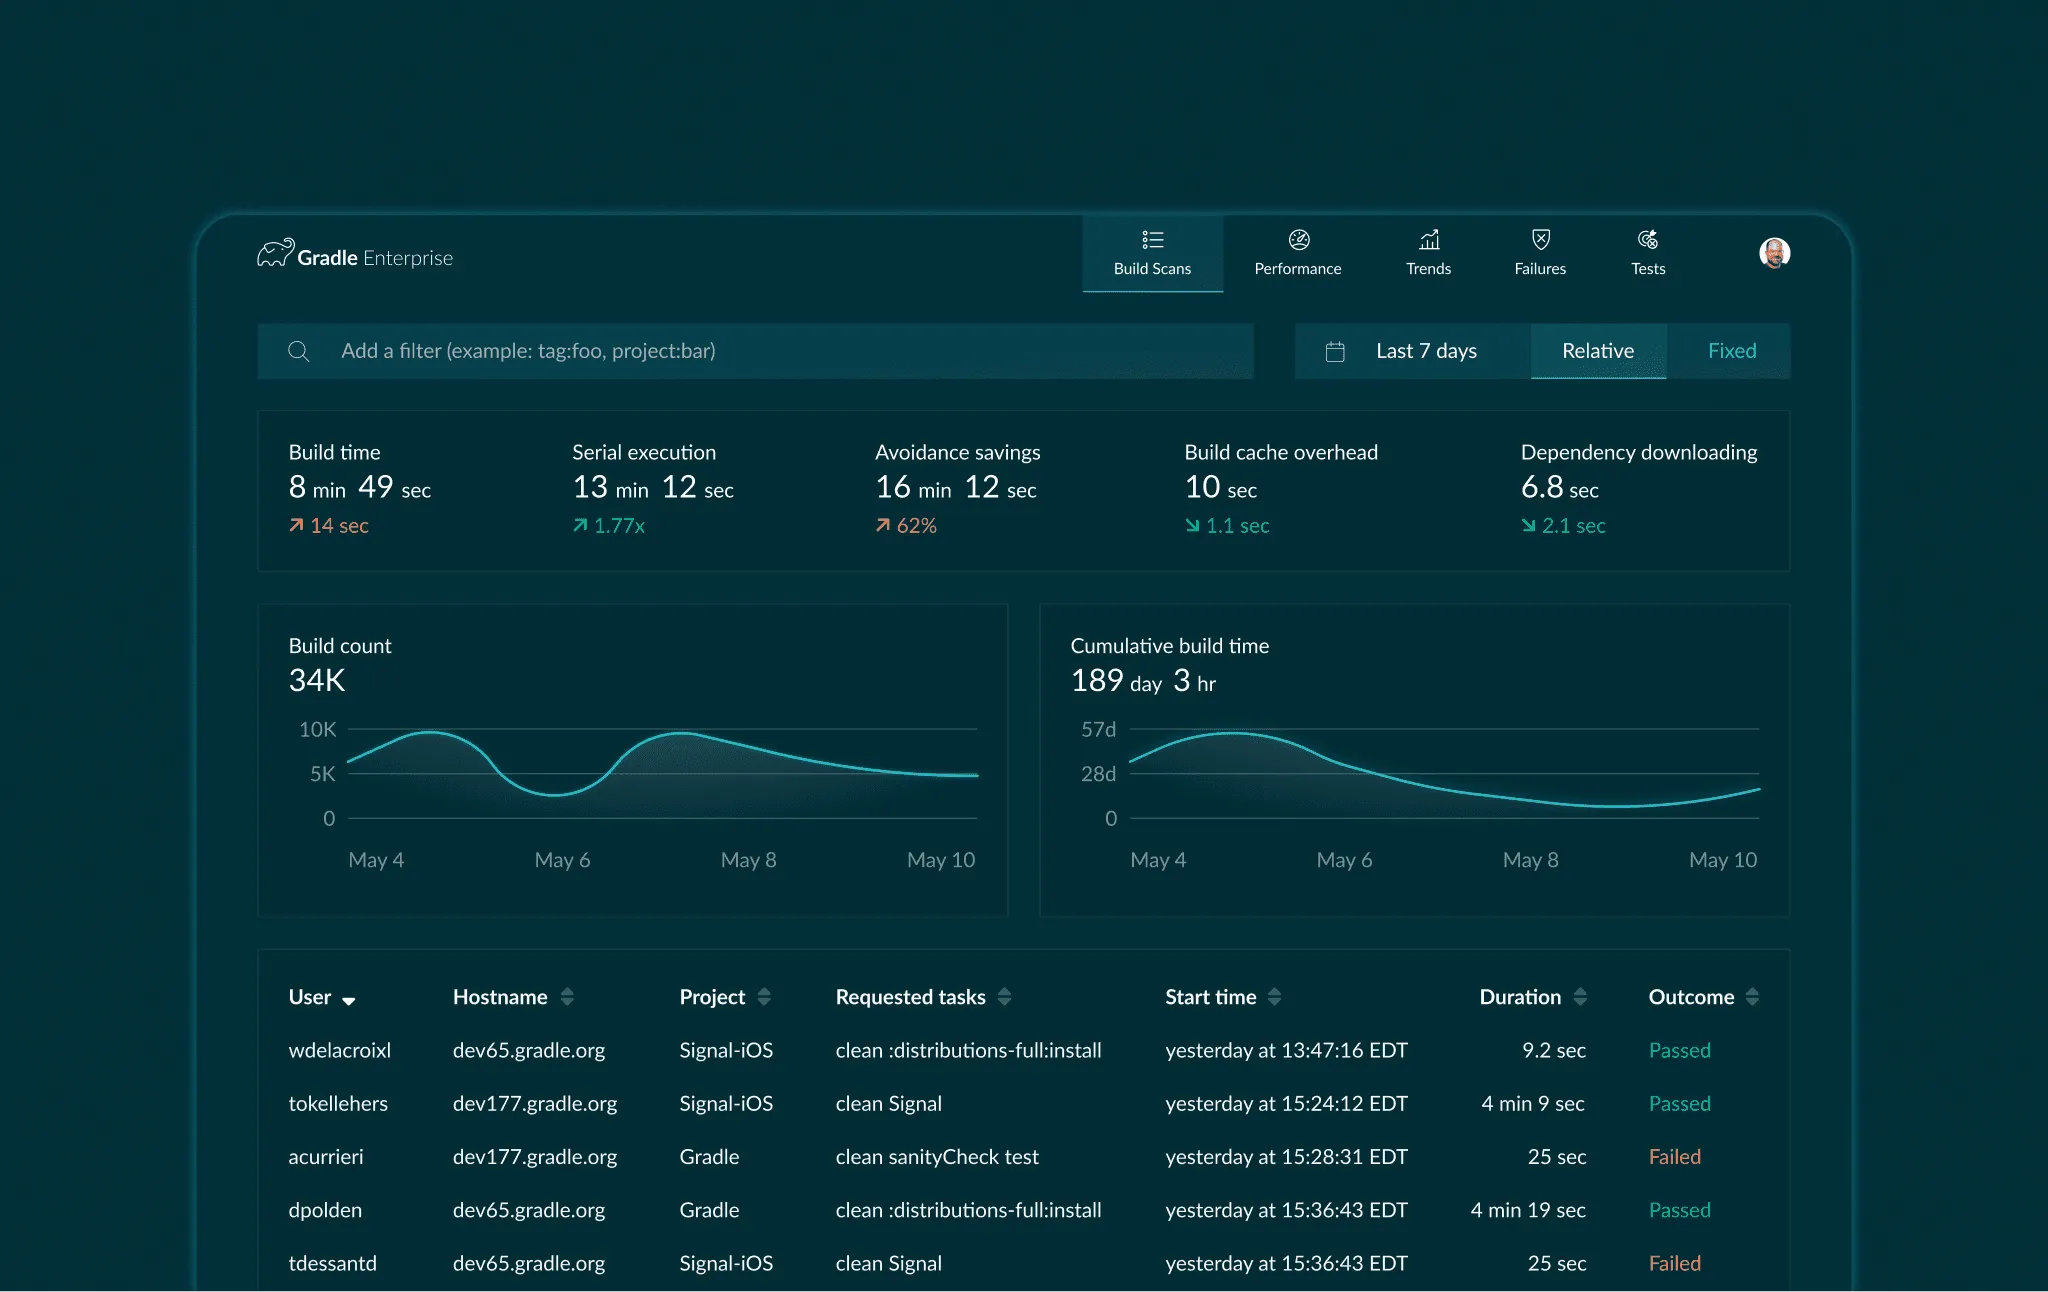
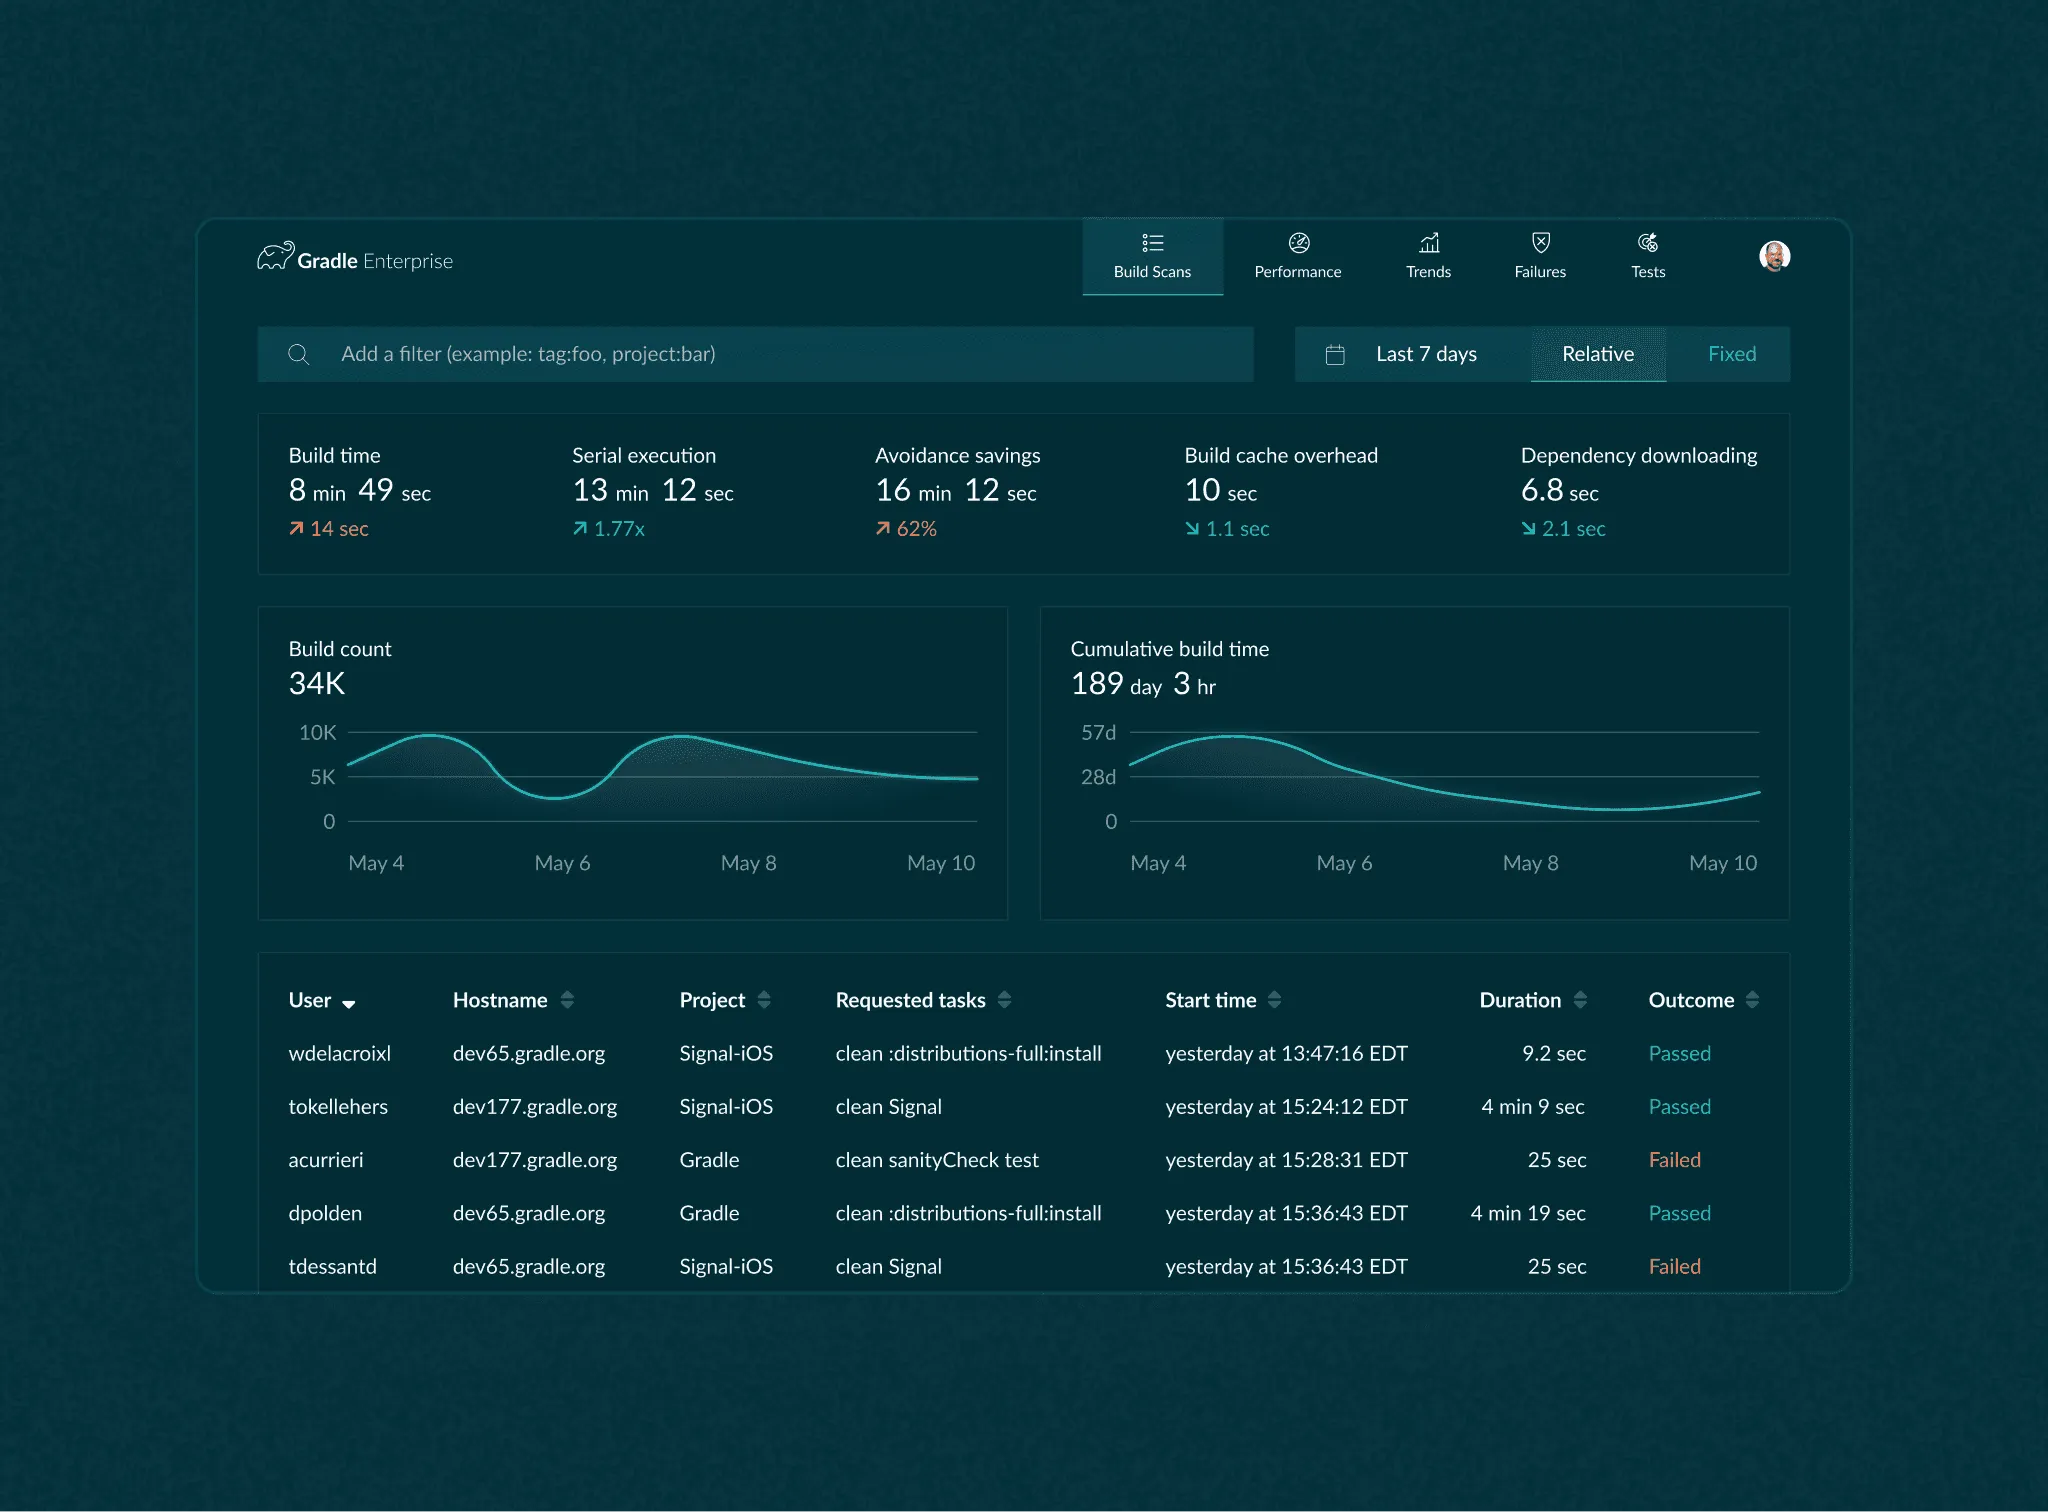
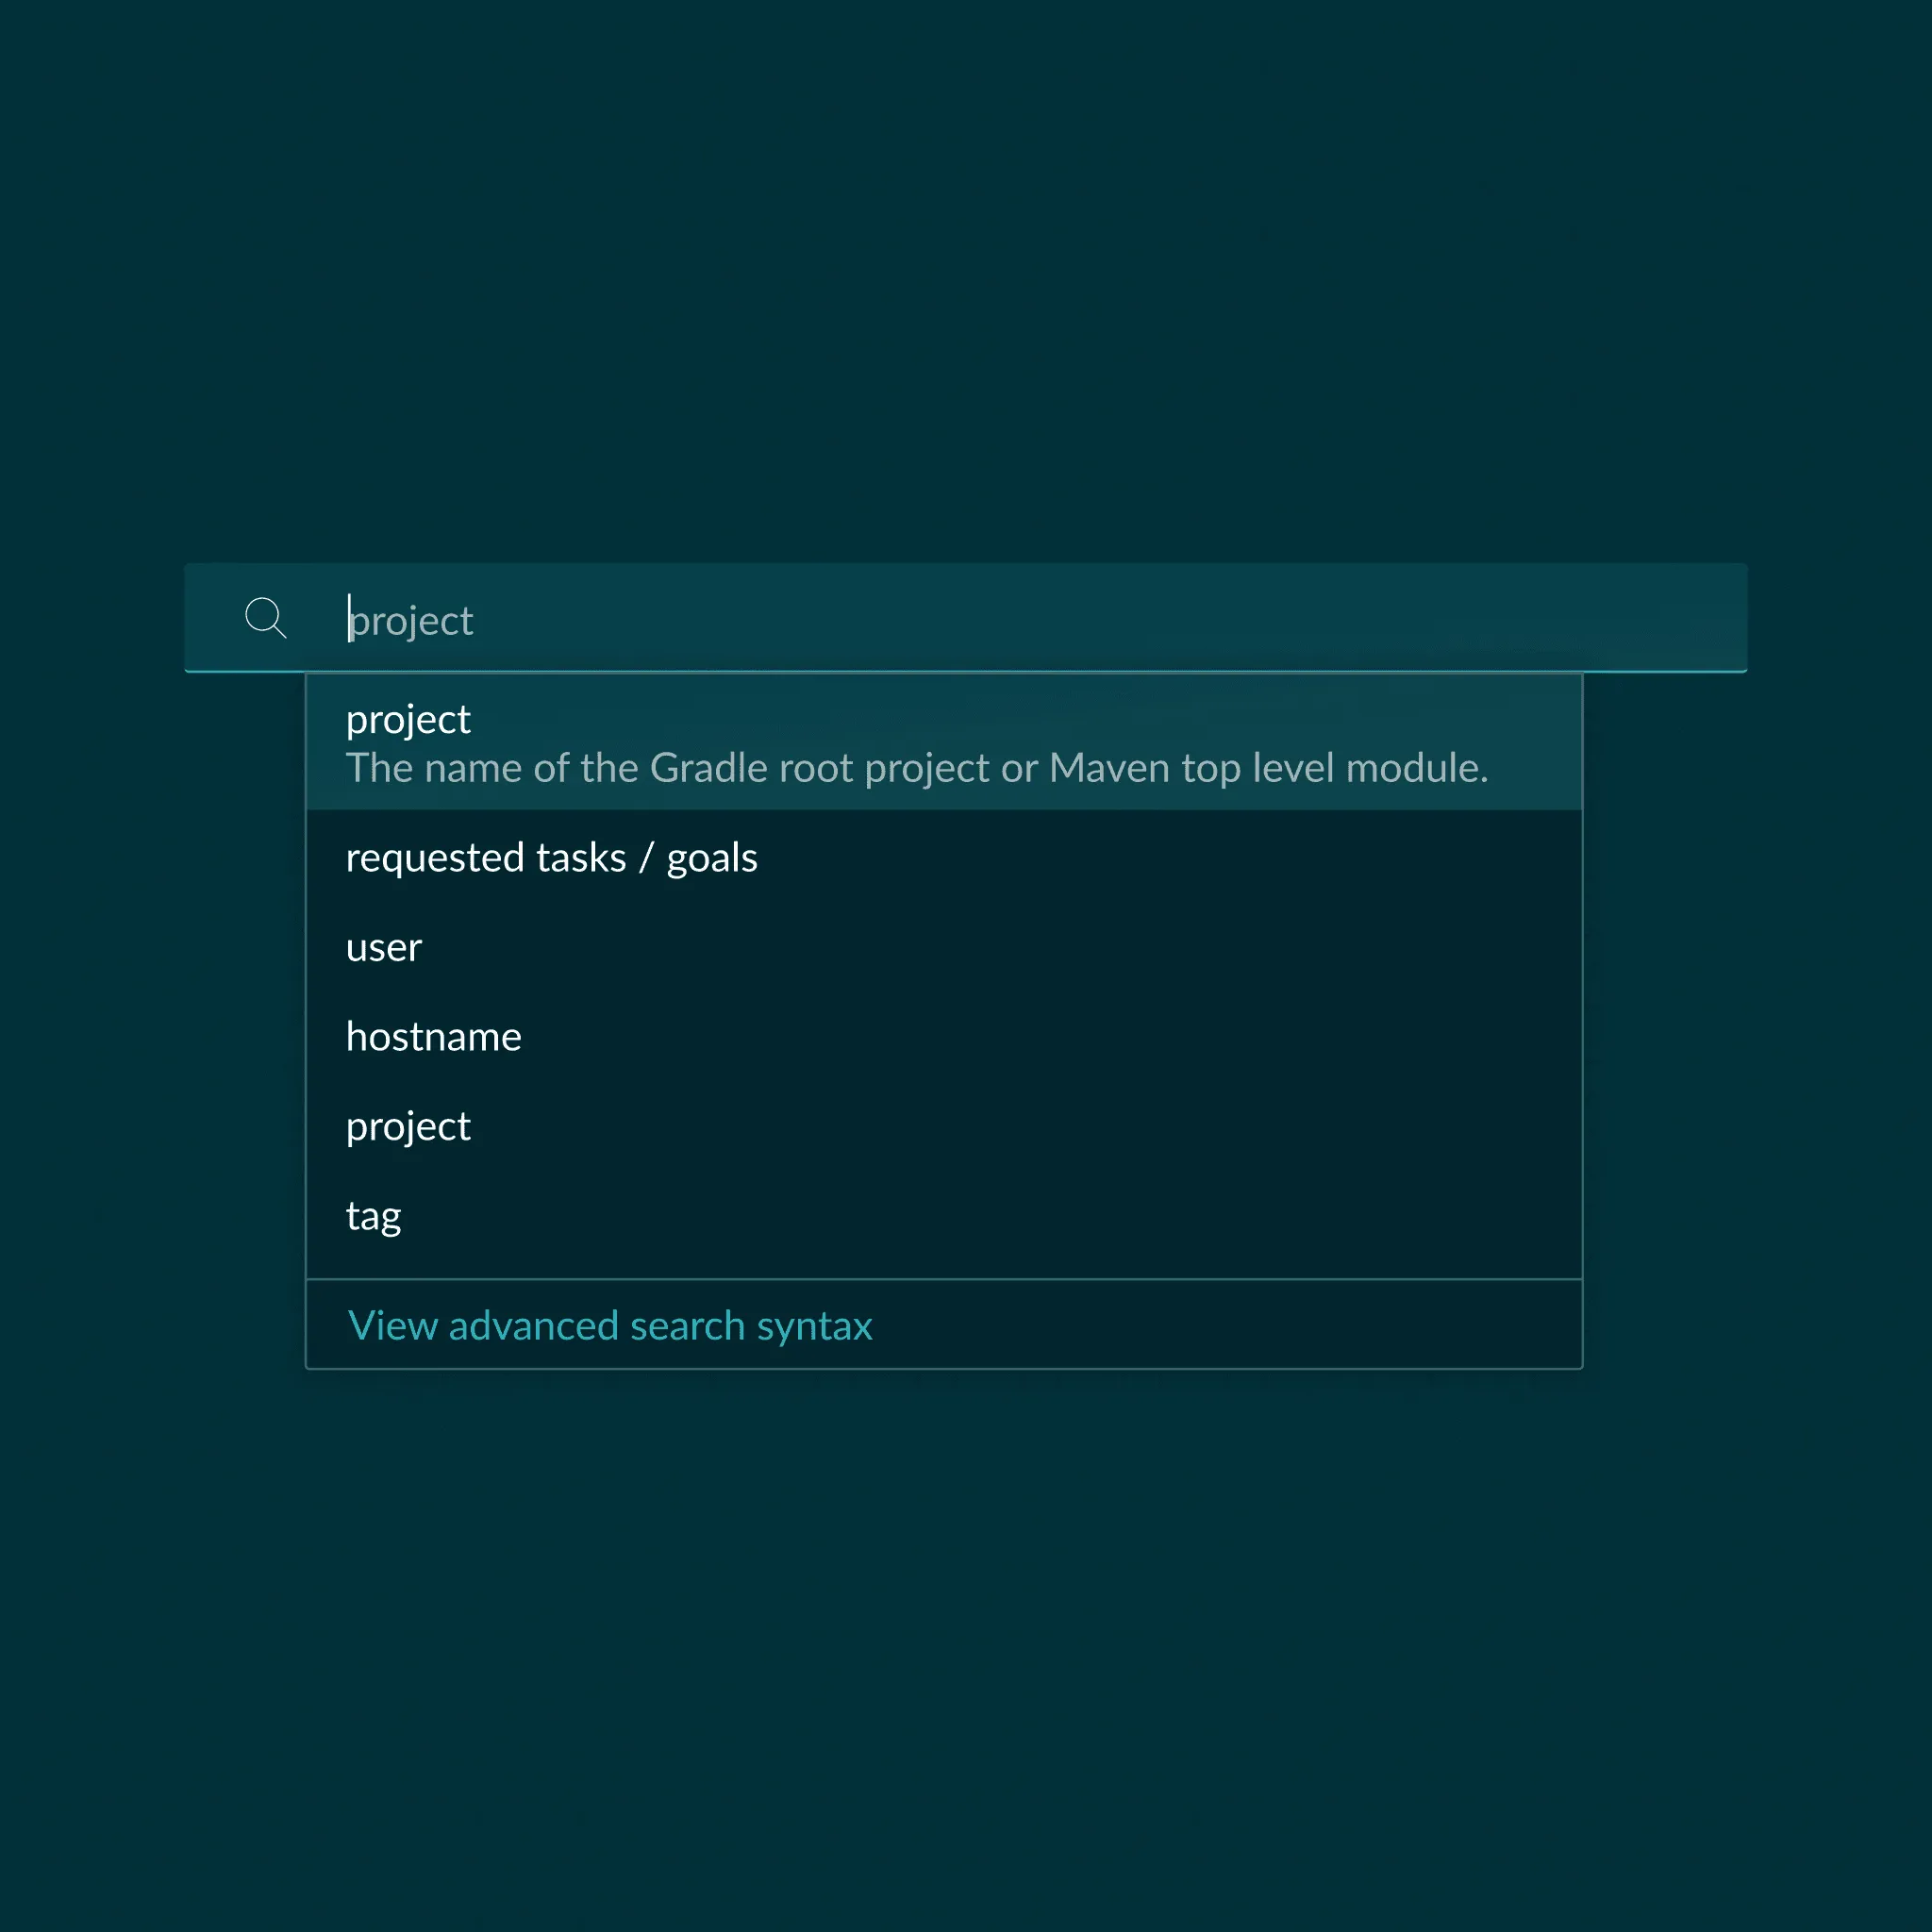
The filtering pattern replaces a dozen scattered dropdowns with a single typed input. Users describe what they’re looking for and the omnibar surfaces filter conditions they can stack. The behavioral signal that triggered the project was loud: customers were exporting to CSV and slicing data in spreadsheets. A product that pushes users into Excel has a filter problem, not a data problem.

The original concept was a visual query builder with a clickable canvas. It was too slow for experts and still too opaque for beginners. A typed input made one interface serve both audiences.

Typed suggestions surface the taxonomy

A new user types “slow” and the omnibar offers “duration greater than” and “status: failed” as next steps. They learn the filter types by using them, not by reading documentation.

The Gradle Enterprise omnibar with typed filter suggestions

Implicit AND across stacked filters

Most diagnostic queries are AND chains: “slow tests AND failed AND in module X.” V1 defaulted to implicit AND and skipped the full boolean builder. Most of the analytical value for a fraction of the interaction cost.

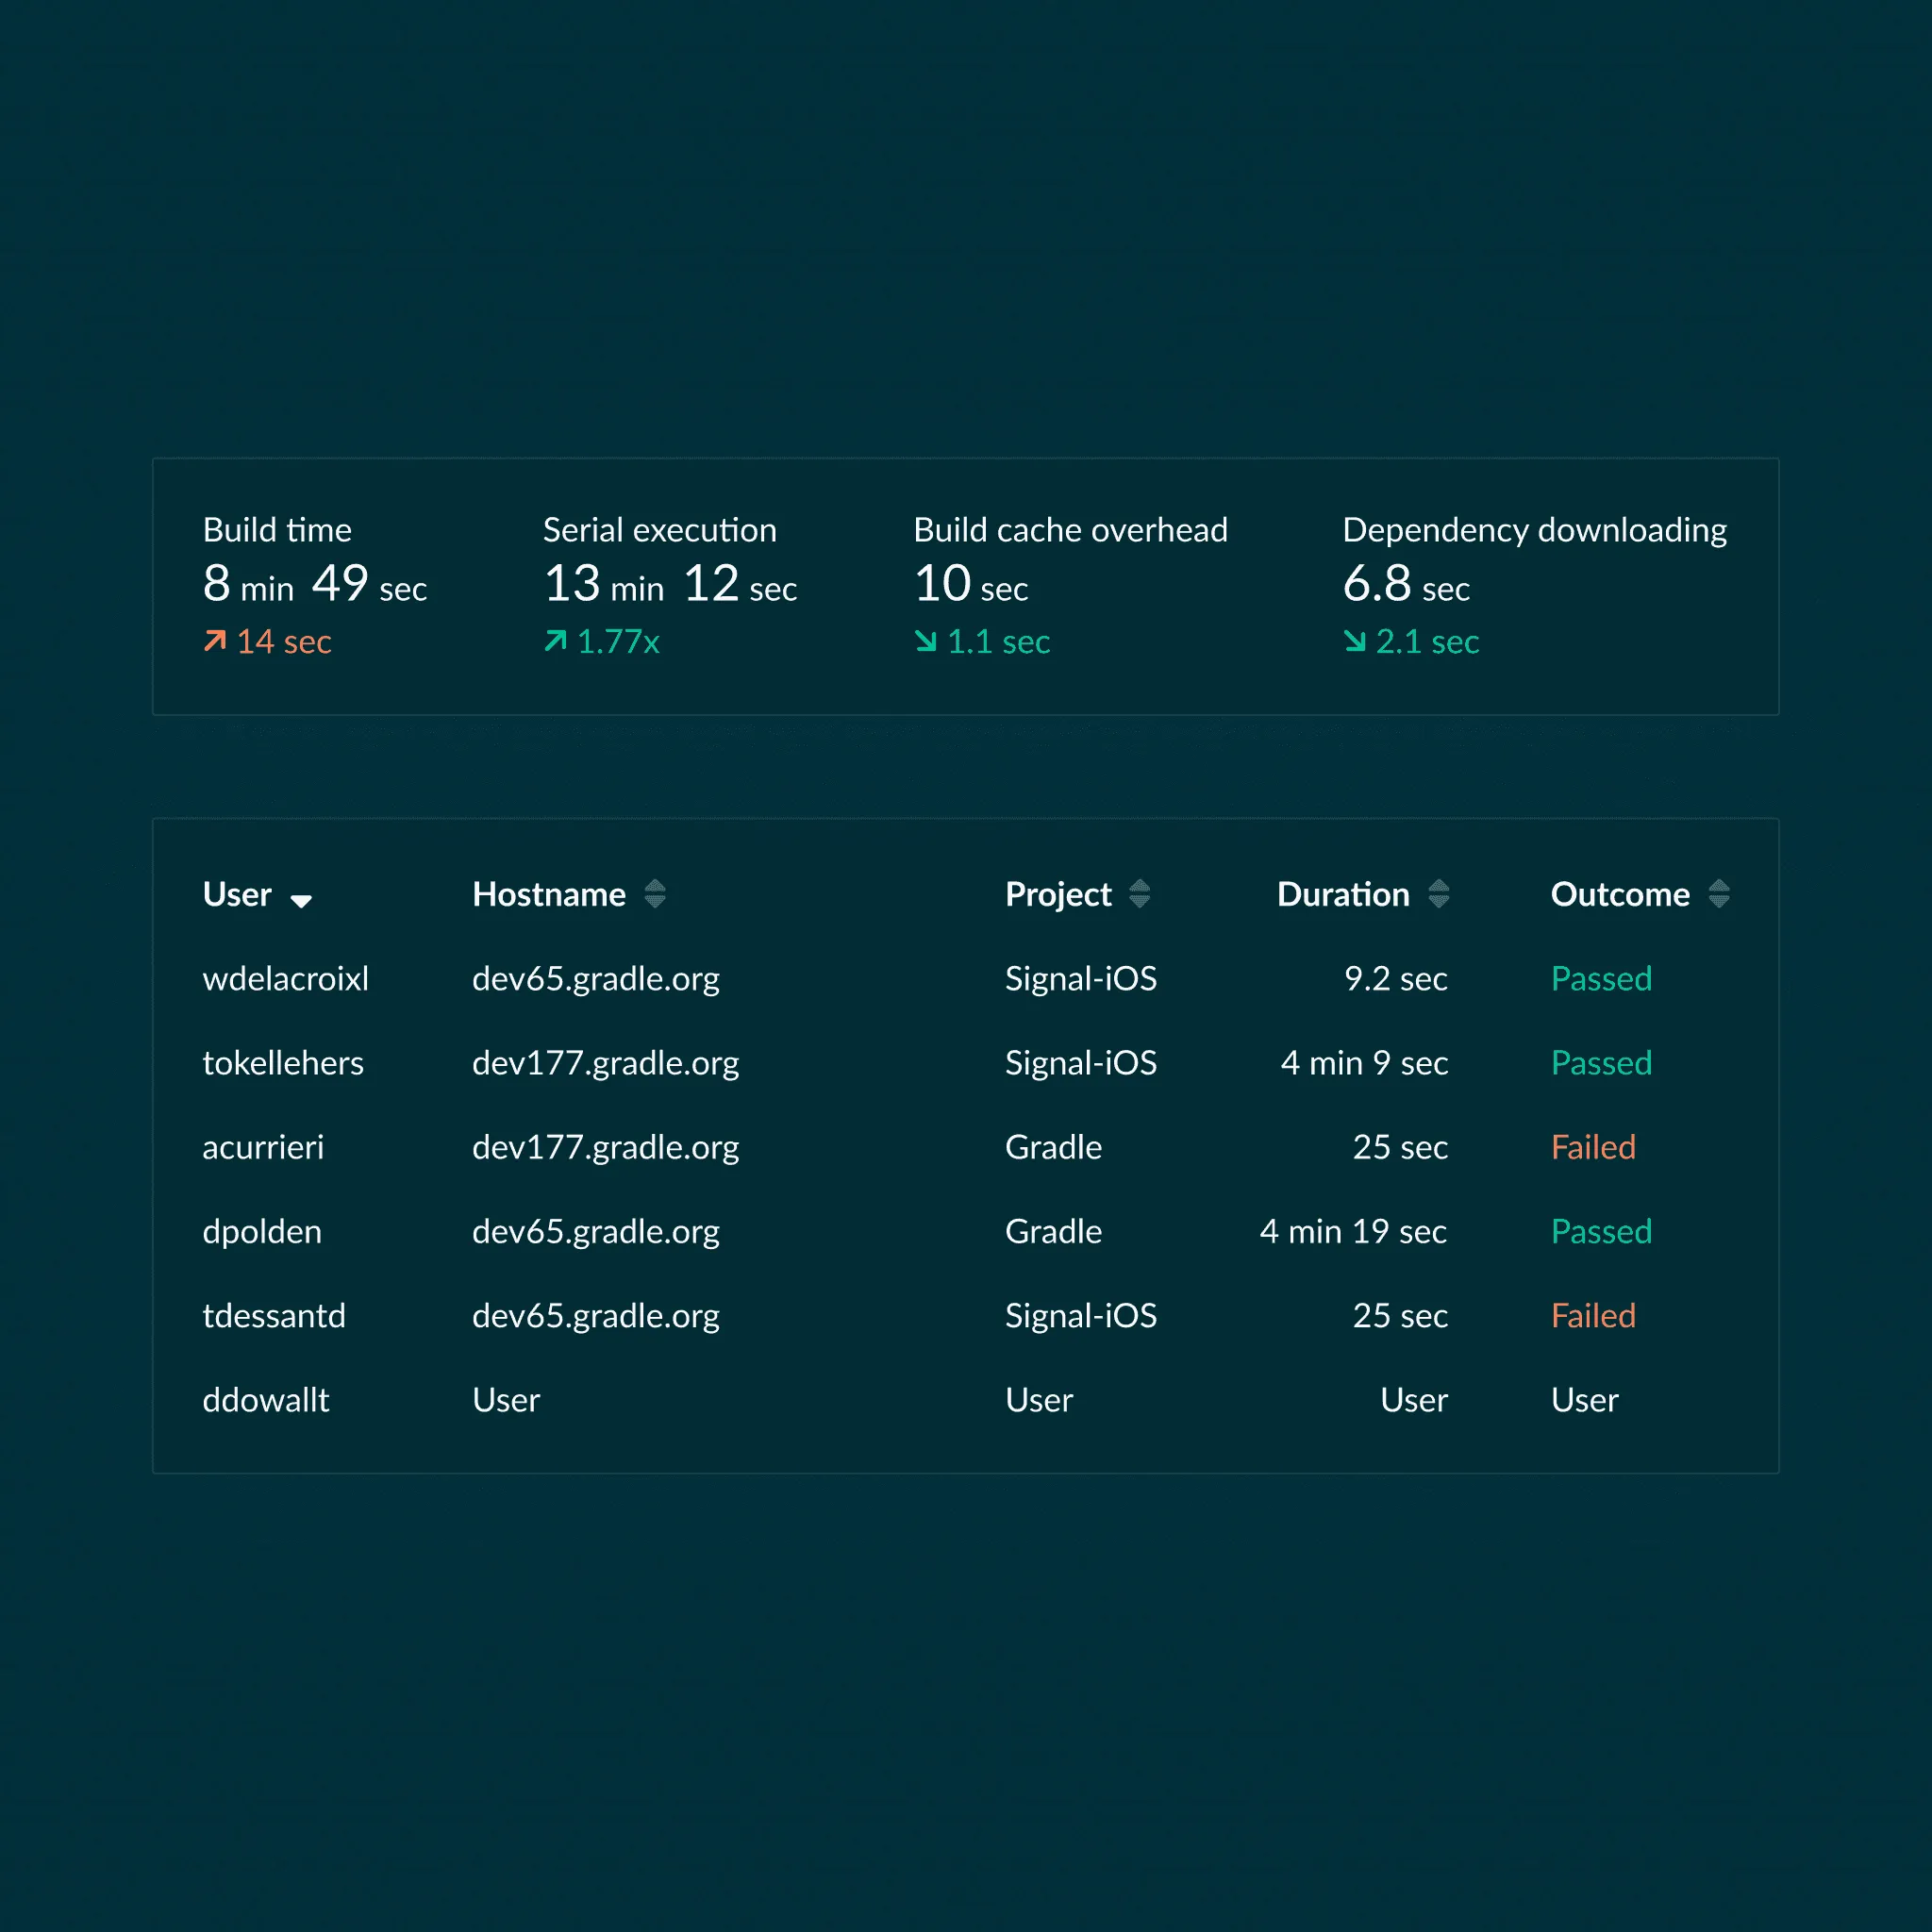
We prototyped against Gradle’s actual build event data, not fixtures. Edge cases surfaced during prototyping: huge datasets, odd chains where suggestions misfired. Engineering saw the failure modes in a prototype and moved.

Stacked filter conditions visible as pills inside the omnibar input

A pattern that fed every diagnostic view

The omnibar wasn’t just a filter for one screen. The same filter chain drove every downstream view: the scoped task list, the diagnostic detail, and the summary aggregations. One pattern, learned once, applied everywhere.

A filtered data view showing slow build tasks scoped to a specific module
The diagnostic view after filtering a large dataset
A summary view of filter results with counts and trends

Results

Users stopped asking for CSV exports. When a customer who has been living in Excel goes back to a product’s native filtering, the interaction is landing.

The omnibar in use, showing typed suggestions and stacked conditions
Typed suggestions and stacked filter conditions.

“We’d love to see the ability to add it to other filter selectors as well.”

That quote mattered most. It was the moment the omnibar stopped being “the new filter on one view” and started being “the filter pattern for the product.” Customer pull is what made the cross-team rollout possible. Every feature team eventually adopted it.

Credits

Design: Ari Zilnik

Engineering: Rob Lucha

Shipped at Gradle (now Develocity).